4.4. Confidence
пн, 19/01/2015 - 21:59
Proper confidence intervals is probably the most valuable feature of TARAN, as it allows you to know how much you can trust your measures (and also, incidentally, to discard statistically invalid bullshit claims).

Just as for PoI above, it can be considered as an interval where the real value is very likely to be. For instance, if statistical modelling shows R50 of 0.35 MOA with confidence interval of -13%..+18%, it means that the real R50 of the rifle is highly likely to be between 0.30 and 0.41 MOA.
The confidence interval in percent is the same for all precision values -- sigma, R50, R95, etc.
The pale green doughnut around the R95 circle is the graphical representation of the confidence interval.

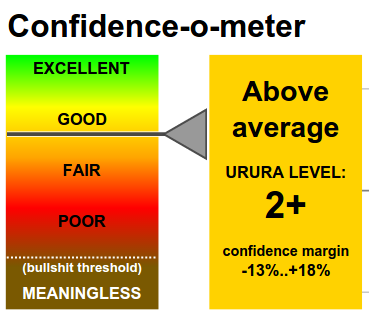
The Confidence-o-meter

Last but not least -- the Confidence-o-meter is an attempt to set some quality standards in the business of amateur rifle precision measurement.
"Amateur" does not mean "poor" or "unscientific". It designates rifle precision measurement within the means of a shooting enthusiast (as opposed to military research), who cannot afford to burn a few dozen barrels and a truckfull of ammo just to get to a hit prob figure.
The URURA scale of confidence goes like this:
CI = total Confidence Interval, in percentage of the measured value
NS = approximate number of shots needed (give or take a few -- confidence intervals depend on actual shot distribution)
| LEVEL | CI | NS | Description |
|---|---|---|---|
| 0: useless | >50% | <17 | does not clear the bullshit threshold |
| 1: barely significant | 50%-45% | 19 | gives only a very vague idea |
| 1+: poor | 45%-40% | 22 | still useless for most practical purposes |
| 2: fair | 40%-35% | 24 | probably the lowest practically acceptable level |
| 2+: above average | 35%-30% | 32 | for occasional shooter |
| 3: good | 30%-25% | 45 | for serious shooting enthusiast |
| 3+: very good | 25%-20% | 63 | perfectly good for most practical applications |
| 4: awesome | <20% | 96 | IDKFA! |