All articles by tag

TARAN Target Analysis and Rifle Precision is a piece of software to determine shooting precision, by aggregating shot information from multiple targets and groups.

This manual is available either as a paged book, or as one long single document.

TARAN is free open source software under GPL3 license. TARAN does not collect any personal data. There is no catch.

Why TARAN: http://guns.ptosis.ch/node/13
How it works / features: http://guns.ptosis.ch/node/14
Some screenshots: http://guns.ptosis.ch/node/15
FAQ: http://guns.ptosis.ch/faq-page
Why would you need it (use cases): http://guns.ptosis.ch/node/44

Download: http://guns.ptosis.ch/node/43

***

There are two options to run TARAN:
Hosted: http://taran.ptosis.ch/taran.html
Local downloaded from the downloads page.

The two versions are exactly the same. To run the downloaded version, grab the ZIP file, unpack the archive files to some folder on your computer, and open "taran.html" with your favourite Web browser. Also, you may want to check out the System Requirements.

***

How to use it all is best described by example. This manual walks you through a TARAN project -- from basic parameters definition to aggregated analytics -- explaining everything you see on the screen.

The interface of TARAN is split into three panes, that can be accessed with the toolbar at the left side of the screen:

1. the project pane --

2. the target pane --

and 3. the analysis pane --

The project pane is used to define project parameters (distance and calibre) and manage attached target images.

When you switch to the project pane, three additional buttons appear on the toolbar:

New project

Discards all data and starts a new project. The same can be done by simply reloading the browser window.

Save project

Saves the project to a file (XML format), including all parameters, targets, shots, analysis, etc. -- everything. You should save your project before you close your browser or reload the TARAN page, otherwise all data will be lost.

Open project

Loads a project from file.

This is pretty self-explanatory. There are some basic sanity checks built-in, which prevent entering obviously wrong values (e.g. distances beyond 3000 m/yd). When happy, click OK.

Click on "Add target", and select a target image file from your device. (You may wish to first check the FAQ item "What kind of target images I can use in TARAN?")

What you see here is a scaled-down preview of the image, just to set correct orientation; don't worry, you will see many more detail in a minute.

The checkbox "Optimise image resolution (improves performance)" does what it says -- downscales the image to max 2048 pixels in largest dimension. Modern cameras and scanners by default produce very high image resolution, which is not necessary for target analysis, but requires a lot of memory to process, slows down operations and makes huge save files. I would recommend to leave the checkbox on, unless you absolutely want to... well... I have no idea why one would want to keep the original resolution (but the option is there). Optimising the resolution is especially important for handling projects with many target images on low-memory devices, such as tablet computers.

If the image is sideways or upside-down, rotate it using the toolbar buttons.

When happy, click confirm

(or cancel to discard this image)

NOTA BENE: make sure the image is correctly rotated before proceeding. Once the image is added to the project, it is not possible to change its orientation; the only way is to remove it from project and add again.

The target pane is used to indicate where the actual shots and groups are on your targets.

To the left you see the navigation panel. If there are multiple targets in the project, you can jump to the next and previous target using the navigation buttons.

Now check the right-hand part of the screen, where the big target is. You can zoom-out, zoom-fit, and zoom-in the image with these:

Zooming in is very practical if you want to see the details of the image (e.g. for greater precision to mark shot locations). I would recommend to use the toolbar buttons, rather than browsers' built-in zoom features, because the toolbar zoom does not enlarge or reduce the rest of TARAN interface -- if you want to zoom in really deep, the built-in browser zoom quickly gets messy.

First, you need to tell the software how long is one millimetre (or one inch), so that distances can be correctly estimated.

This is rather straightforward -- use a known length on the target, click where the starting point is

and confirm with "ok".

(the starting point turns acid-green)

Then click where the ending point is

and confirm with "ok" (the whole length turns acid-green).

In the scale length input

enter the actual scale length (depending on your measurement system choice -- in mm or in inches), and confirm with "ok". The scale is set now:

The known length does not have to be horizontal (as in this example), it just needs to be known. To establish scale it is better to choose a rather large length (bigger than 10 cm / 4") -- the longer it is, the more precise are the measurements.

When the scale is set, a new button appears on the toolbar.

This, my friend, is to define a new group. A group is defined by marking the point of aim (PoA); the usual drill: click on the toolbar button, click on the target where PoA is, confirm with "ok".

TIP: zoom in to mark the group PoA precisely.

To delete a group (with all associated shots!) use the group delete button:

Now that the group is defined, we can start marking shots. Notice the new button:

As usual: click the button, click on target where the shot is, confirm with "ok".


(marked the shot nearest to PoA)

As soon as you mark a second shot, two additional elements appear on the image:

The blue line is extreme spread, connecting two furthest shots in the group. The orange circle is the average point of impact (PoI). Both are calculated immediately as you add or remove shots. Here is the final picture of the group:

The "Delete shot" button deletes the last shot marked in the group

If you want numbers, just toggle the "Display groups infoboxes" checkbox.

And voilà:

A box appears with group's extreme spread in your favourite units, and horizontal+vertical distances between the group's PoA and average PoI. (I did not bother to calculate or display any other "statistics" for individual groups, see "Why TARAN does not calculate and display more information about groups?" FAQ item.)

Of course, you can. Just mark a new PoA, and it starts a new group.

The lower group is selected -- it has extreme spread displayed, and appears in brighter colours.

You can select a group either by clicking on the group's PoA, or -- notice changes in the left-hand navigation pane:

A summary of all group stats appears in the navigation pane just below the target preview. You can also select a group by clicking on group header (with the group icon, #, and shot count).

Suppose I have shot some beautiful groups, and want to show off on my favourite Internet forum. TARAN has a feature for that:

The "Export image" button saves the current target image with all marked groups and shots.
- The target image is saved at the current zoom level
- All groups are selected, with ES and average PoI info boxes displayed
- The image is stamped with the project parameters (project title, distance, calibre), software version and timestamp

Here's an example: http://guns.ptosis.ch/sites/default/files/mkan.png

Once we're done with a target, we can get back to the project pane to add more targets to the project, and have a general overview.

"Add target", as you can guess, adds a new target.

To delete a target from the project, click on the target header with the "Delete target" icon

Clicking on a target image selects it and switches to the Target pane.

When we're done with all targets and all groups in the project, we can switch to Analysis pane

The analysis pane is why TARAN has been written in the first place (the rest of it is just callipers with attitude).

It represents aggregated data from all shots registered in the project. As a reference, a 1MOA circle is drawn in dotted orange.

The grid can be selected (or switched off) by clicking on "Off", "0.05 mrad" or "1/4 MOA" in the left pane.

In the centre, the orange circle represents the average PoI for all shots from all groups. Basically, it tells you how much off is your scope zero from the PoA (red circle).

The pale orange area around the average PoI is error margin. The error margin corresponds to 95% confidence, and, strictly speaking, means that if I shot an infinite number of similar projects, in 95% of the cases the true average PoI would be somewhere in this pale orange area (which may be different for each project).

In plain English, one can consider that the real PoI is *very* likely (statistically likely) to be within the error margins.

As mentioned here and here, a single group's extreme spread as a measure of rifle precision is both scientifically invalid and practically useless.

Rifle precision can, however, be rather accurately described by known statistical models. TARAN uses the Rayleigh distribution model to calculate precision parameters. The outcome of the modelling is presented in the left-hand pane:

* SD (a.k.a. sigma) is the normal distribution's standard deviation (and Rayleigh's scale parameter).
* R50, also known as Circular Error Probable (CEP) or Mean Radius, is the radius, which would statistically contain 50% of all shots -- a very common ballistic and military measure of a weapon's precision. A caveat on this one: it is a result of a mathematical model, and represents what would happen with an infinite number of shots; the actual shots accounted for in the project may be distributed slightly differently, and not exactly fall 50/50 inside/outside of R50 (but with enough shots it should be very close).
* D5x and D10x, calculated mostly for entertainment purposes, represent the average extreme spread of 5-shot and 10-shot groups that can be expected from the rifle. Nota Bene: it does not mean that shots of such groups will be contained in a given diameter circle around the average PoI; actual centres of groups may be very different from the real rifle's PoI and it's mathematical estimation.
* R95 and R99 -- respectively radii containing 95% and 99% of the shots. R95 is a good indication of a "likely hit" probability.

You can toggle the display (thin grey circles) of SD, R50 and R99 by clicking on small buttons in the corresponding rows. On the example image above, R50 is displayed.

R95 is displayed as a thick green circle.

Notice the slider 0%..99%.

It is a basic hit probability calculator. Any non-zero position of the slider displays a red circle with the associated radius and hit probability.

Of course, it only works for the same conditions as for the project targets -- specifically, the same distance -- but can be a valuable tool for classic (ISSF or CISM) sport shooters, for score estimation, and can also provide an immediate answer to idle questions like "how likely am I to hit a 1 MOA circle".

Proper confidence intervals is probably the most valuable feature of TARAN, as it allows you to know how much you can trust your measures (and also, incidentally, to discard statistically invalid bullshit claims).

Just as for PoI above, it can be considered as an interval where the real value is very likely to be. For instance, if statistical modelling shows R50 of 0.35 MOA with confidence interval of -13%..+18%, it means that the real R50 of the rifle is highly likely to be between 0.30 and 0.41 MOA.

The confidence interval in percent is the same for all precision values -- sigma, R50, R95, etc.

The pale green doughnut around the R95 circle is the graphical representation of the confidence interval.

The Confidence-o-meter

Last but not least -- the Confidence-o-meter is an attempt to set some quality standards in the business of amateur rifle precision measurement.

"Amateur" does not mean "poor" or "unscientific". It designates rifle precision measurement within the means of a shooting enthusiast (as opposed to military research), who cannot afford to burn a few dozen barrels and a truckfull of ammo just to get to a hit prob figure.

The URURA scale of confidence goes like this:

CI = total Confidence Interval, in percentage of the measured value
NS = approximate number of shots needed (give or take a few -- confidence intervals depend on actual shot distribution)

LEVEL CI NS Description
0: useless >50% <17 does not clear the bullshit threshold
1: barely significant 50%-45% 19 gives only a very vague idea
1+: poor 45%-40% 22 still useless for most practical purposes
2: fair 40%-35% 24 probably the lowest practically acceptable level
2+: above average 35%-30% 32 for occasional shooter
3: good 30%-25% 45 for serious shooting enthusiast
3+: very good 25%-20% 63 perfectly good for most practical applications
4: awesome <20% 96 IDKFA!

Two buttons --

One -- save report:

Saves the analysis report, as it appears on the screen, to a vector image file in SVG format.

Two -- export shots table:

Saves the project shots as a table in CSV format (can be opened by Excel, Libreoffice/Openoffice Calc, etc.) for further analysis. The co-ordinates of shots are in real units (mm or inches, depending on project settings), relative to PoA.

Now that we've got nice reports, and a deep warm feeling of being scientifically valid, one may wonder -- what's the actual practical point? Well, in addition to having firm data for further hit prob analysis (such as, for example, Bryan Litz's excellent WEZ modelling), there are a few immediate practical uses, mostly relying on knowledge of confidence intervals:

Load development

Q: How do we know if load A is better than load B?
A: We shoot until confidence intervals no longer overlap.

A real example (~15 shots per load):
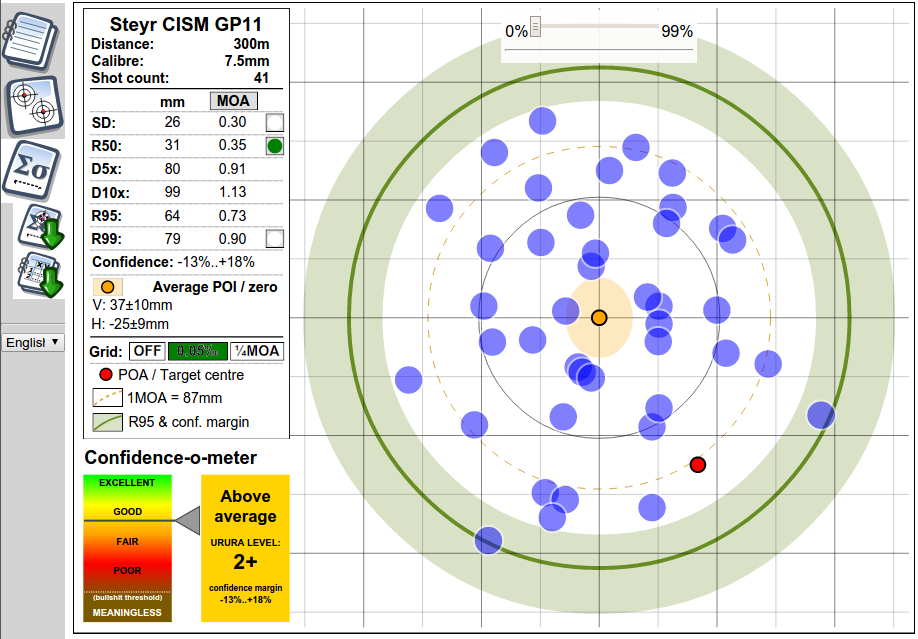
Load A -- R50=0.31MOA, CI=-21%..+35%, that is R50 is between (0.31*0.79)=0.24 and (0.31*1.35) = 0.42 MOA
Load B -- R50=0.39MOA, CI=-20%..+35%, that is R50 is between (0.39*0.8)=0.31 and (0.39*1.35) = 0.53 MOA

There is a large overlap between the statistically plausible R50 values for the two loads -- 0.24-0.42 and 0.31-0.53. Therefore, we cannot conclude that one load is better than the other -- the difference may be a result of sheer randomness. Therefore, we keep on shooting.

(In fact, in this particular example, it actually *was* sheer randomness; after 30 shots per load, the loads were very close at R50 of 0.33 and 0.35 MOA respectively; there was still no significant statistical difference.)

Zeroing a scope

I love this example.

Some time ago at the range I have witnessed an absolutely dramatic scene: a guy has wasted more than one hour and a crapload of ammo in an attempt to achieve perfect zero. He was going -- three shots, average, adjust sights, another three shots to confirm... and he was completely elsewhere, adjust again, so repeating the same procedure over and over again. He blamed the scope, he blamed the mount, he blamed the electronic target system, not realising that the information on the POI he was getting from 3 shots was simply statistically insignificant.

This is a rather extreme example of intelligence, but it did happen to me to zero on a 5-shot average PoI, and actually be 2 clicks off PoA.

Answer: to achieve perfect zero, shoot until confidence intervals on average PoI get below half a click of your scope -- then you are scientifically sure that zero is the best you can get with given click values.

Obviously, the number of shots necessary to get there wildly varies with rifle's precision. Zeroing on 5 shots may be perfectly ok for a BR railgun, but with a Romanian AK you may still not know where you are after two magazines downrange.

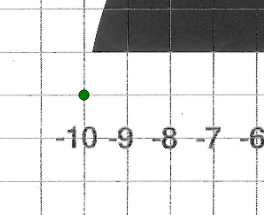
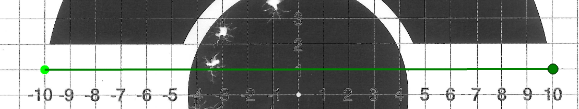
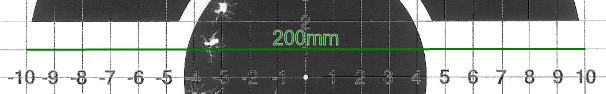
Example: with a K31 and surplus 7.5 Swiss ammo, it took me 17 shots to get the PoI confidence intervals below +/-15mm at 300m (that is -- less than half of 0.1mrad = 30mm click).

Avoid overscoping

As common shooting wisdom goes, a scope helps to see better, not to shoot better. There is no point getting a scope to see something that you cannot hit with reasonable certainty.

If R95 of your rifle is ~1-1.5MOA, a 10x or 12x scope is perfectly sufficient to clearly see (that is -- comfortably aim) the smallest target that you can hit with certainty. Bigger zoom = dead weight and waste of money. You only need 20x or 25x if your rifle+cartridge combo is capable of R95 within 0.5-0.7 MOA. Otherwise, overscoped it is -- extra zoom money would be better spent elsewhere.